
Iron loft is a hot topic for good reason. It’s one of the first numbers golfers look at when comparing clubs. But with more data than ever on launch, spin and shaft characteristics, we’ve learned that iron loft alone doesn’t tell the full story.
Still, if you’re switching from a game-improvement iron to a player’s model (or vice versa), you’ll feel the difference immediately.
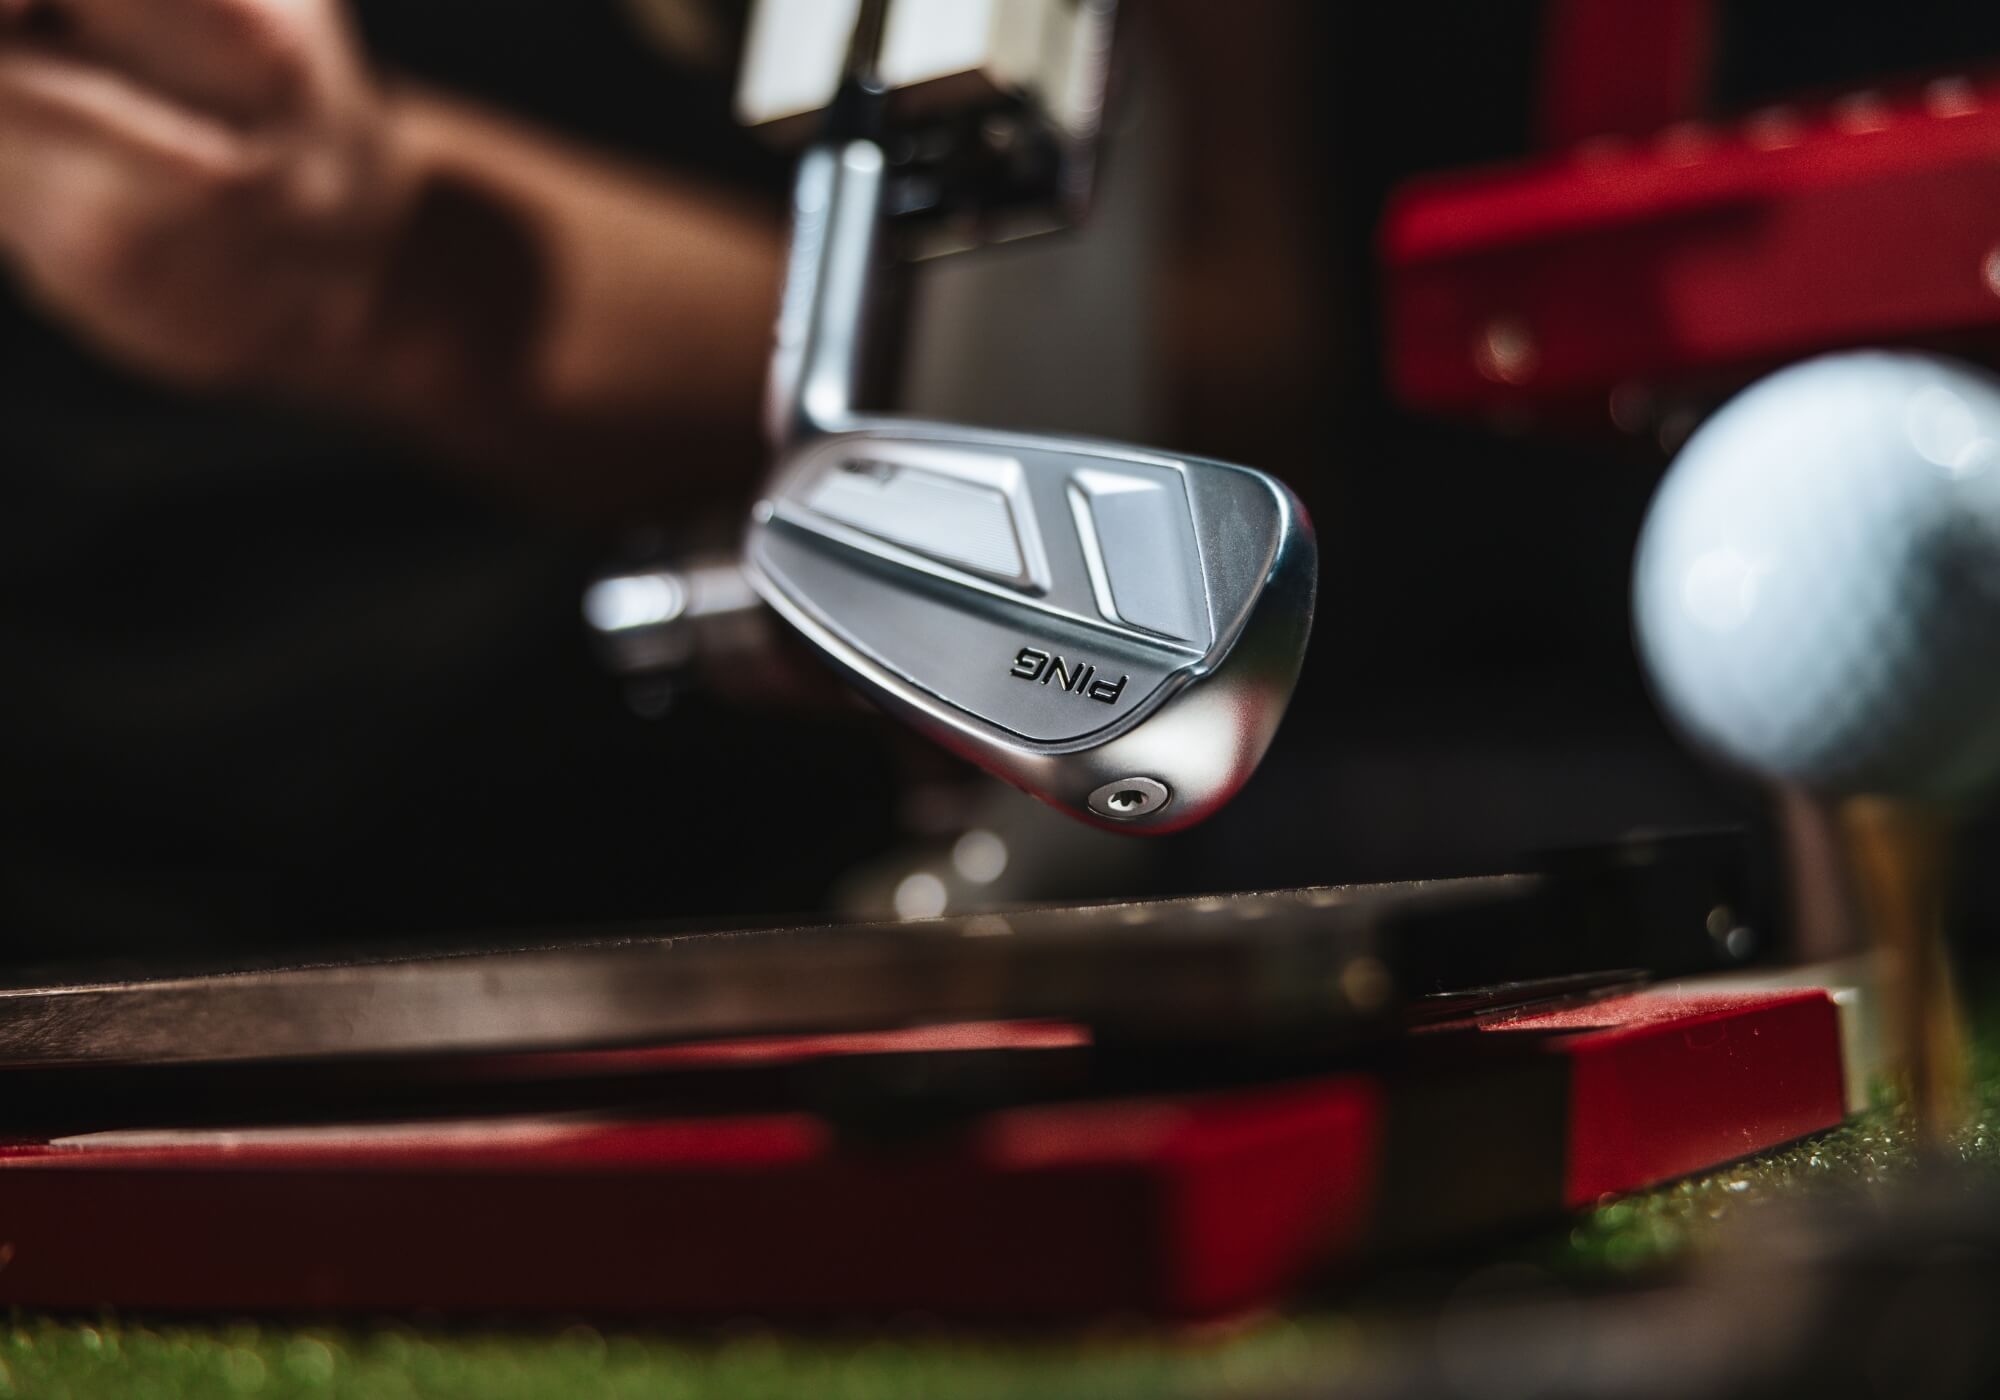
In 2025, we tested more than 65 iron sets across every category. Using that test pool, I researched the stock lofts of each set and created a composite average for every major iron category. While there are small variations from one set to another, this chart represents what you can realistically expect in 2025 for golf iron lofts.
2025 iron loft chart
Here’s how 2025 iron loft averages compare across every major category tested by MyGolfSpy.
| Iron | Player’s | Player’s Distance | Game Improvement | Super Game Improvement |
|---|---|---|---|---|
| 4-Iron | 23° | 21° | 20° | 18° |
| 5-Iron | 26° | 24° | 22° | 21° |
| 6-Iron | 29° | 27° | 25° | 24° |
| 7-Iron | 33° | 31° | 28° | 27° |
| 8-Iron | 37° | 35° | 33° | 31° |
| 9-Iron | 42° | 39° | 37° | 36° |
| Pitching Wedge | 46° | 44° | 42° | 41° |
The loft gap is big
The difference between the average player’s 7-iron (33 degrees) and a super game improvement 7-iron (27) is six degrees, roughly the difference between a 7-iron and a “5½-iron.” That’s why golfers switching categories instantly notice a change in distance and trajectory.
Why loft alone doesn’t define distance
Manufacturers have learned to pair stronger lofts with design tweaks that make them easier to launch.
By pushing the center of gravity lower and deeper, today’s irons deliver higher launch and lower spin even as lofts get stronger.
Add in shaft and fitting variables (weight, flex, torque, kick point) and you can see why two clubs with the same loft don’t always perform the same. A 30-degree 7-iron in 2025 might still launch higher and stop faster than a 33-degree 7-iron from a decade ago.
How loft varies across brands and categories
Loft strength doesn’t just vary by category. It can also depend on the brand and the individual design of the iron. Some manufacturers build stronger lofts to maximize ball speed and distance while others stay closer to traditional specs for consistent spin and control.
The variation in loft widens when you compare across categories, especially in super game-improvement irons, where design priorities range from pure distance to maximum launch and forgiveness.
| Category | Typical Loft Range (7-Iron) | Variation (±°) | Notes |
|---|---|---|---|
| Player’s | 32°–34° | ±1° | Traditional trajectory and spin-focused designs. |
| Player’s Distance | 30°–31° | ±1° | Slightly stronger lofts for added distance without losing control. |
| Game Improvement | 27°–30° | ±2° | Stronger lofts tuned for higher launch and forgiveness. |
| Super Game Improvement | 26°–29° | ±3° | Strongest lofts; brands push distance over spin. |
Static loft versus dynamic loft
Every iron has a static loft (the number printed on the spec sheet) but what ultimately determines launch and spin is dynamic loft, the loft delivered at impact. Two golfers can use the same 7-iron and produce completely different trajectories. The difference comes from how their hands, wrists and shaft lean affect the clubface at impact.
Dynamic loft is why a player with a shallow delivery can still launch the ball high with a strong-lofted iron while a steeper player might struggle to get the same flight even with a weaker loft. It’s also why fitting matters more than chasing the “perfect” number on a loft chart.
Final thoughts
Iron lofts continue to evolve. If you’re testing new irons this season, don’t just look at the number on the club’s spec sheet. Look at the loft, the launch and the yardage gaps throughout your set.
The post 2025 Iron Loft Chart: Average Lofts By Category (And What They Really Mean) appeared first on MyGolfSpy.