
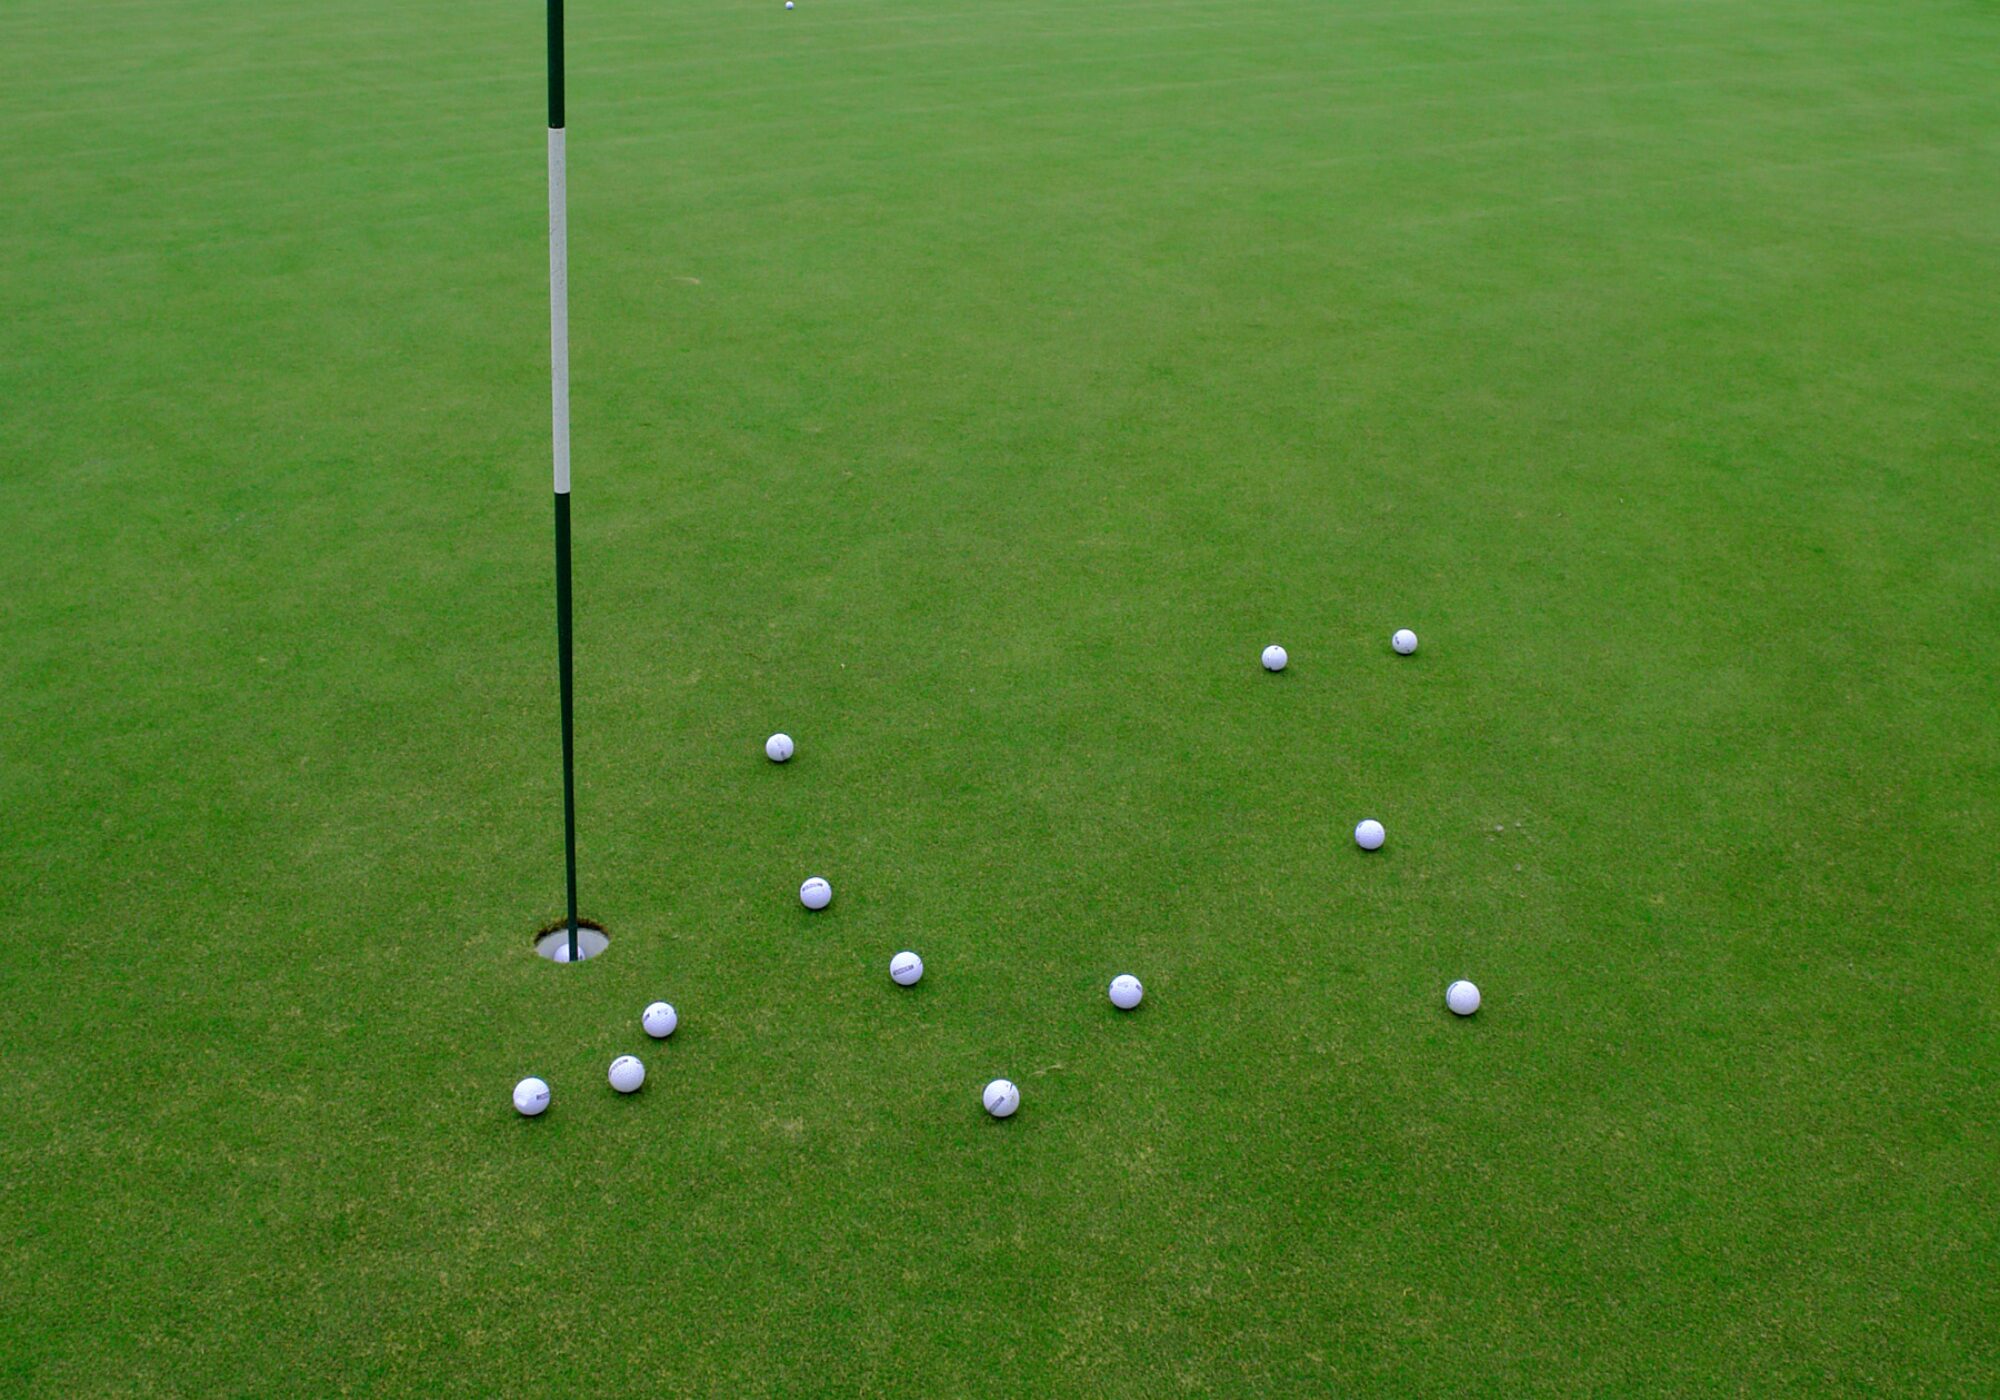
Every golfer wants to hit more greens but scoring well depends just as much on what happens after you miss one. The short game (shots inside 50 yards) is where better players separate themselves.
The charts below show Shot Scope data on how golfers of different handicaps actually perform around the greens. From proximity and up-and-down percentages to total shots needed to finish a hole, you can see exactly where your short game stands and what the next skill level looks like.
| Handicap | Up & Down % | Sand Save % | <25 yds Up & Down | 25–50 yds Up & Down |
|---|---|---|---|---|
| 25 | 25% | 10% | 35% | 9% |
| 20 | 31% | 15% | 41% | 14% |
| 15 | 34% | 18% | 43% | 16% |
| 10 | 39% | 20% | 47% | 20% |
| 5 | 47% | 23% | 56% | 25% |
| Scratch | 54% | 37% | 63% | 32% |
25-handicap short-game performance
At a 25-handicap level, the short game is where most strokes are lost. Players in this range get up and down about one in four tries and usually need just over three shots to finish once they’re within 50 yards.
Proximity averages around 22 feet, leading to long first putts and plenty of three-putt opportunities. Focusing on clean contact and distance control from under 25 yards offers the fastest path to improvement.
| Metric | Value |
|---|---|
| Up & Down % (0–50 yds) | 25% |
| Sand Save % | 10% |
| Average Proximity to Hole | 22 ft |
| Shots to Finish | 3.01 |
| Up & Down % (<25 yds) | 35% |
| Up & Down % (25–50 yds) | 9% |
20-handicap short-game performance
Golfers around a 20 handicap are showing better control, converting roughly one in three up-and-downs (31 percent) and averaging 2.86 shots to finish once they’re within 50 yards. Proximity improves to 20 feet, and the stronger short-range numbers (<25 yards) show that contact and consistency are getting better.
| Metric | Value |
|---|---|
| Up & Down % (0–50 yds) | 31% |
| Sand Save % | 15% |
| Average Proximity to Hole | 20 ft |
| Shots to Finish | 2.86 |
| Up & Down % (<25 yds) | 41% |
| Up & Down % (25–50 yds) | 14% |
15-handicap short-game performance
A 15-handicap golfer’s short game is improving but inconsistency remains. They get up and down about one-third of the time (34 percent) and average 2.78 shots to finish from 50 yards and in. Average proximity sits at 18 feet. Distance control is better but still not good enough for frequent one-putts.
| Metric | Value |
|---|---|
| Up & Down % (0–50 yds) | 34% |
| Sand Save % | 18% |
| Average Proximity to Hole | 18 ft |
| Shots to Finish | 2.78 |
| Up & Down % (<25 yds) | 43% |
| Up & Down % (25–50 yds) | 16% |
10-handicap short-game performance
Ten-handicap golfers are strong around the greens but still lose strokes on longer pitches and inconsistent contact. They convert nearly 40 percent of up-and-down chances and average 2.68 shots to finish from inside 50 yards. Proximity of 15 feet allows more two-putts and occasional one-putts, signaling solid progress toward single-digit golf.
| Metric | Value |
|---|---|
| Up & Down % (0–50 yds) | 39% |
| Sand Save % | 20% |
| Average Proximity to Hole | 15 ft |
| Shots to Finish | 2.68 |
| Up & Down % (<25 yds) | 47% |
| Up & Down % (25–50 yds) | 20% |
5-handicap short-game performance
At the five-handicap level, golfers show control and creativity around the greens. They get up and down nearly half the time (47 percent) and average just 2.55 shots to finish. With average proximity at 14 feet, they consistently set up makeable par saves. The gap to a scratch handicap lies in bunker play and converting mid-range putts.
| Metric | Value |
|---|---|
| Up & Down % (0–50 yds) | 47% |
| Sand Save % | 23% |
| Average Proximity to Hole | 14 ft |
| Shots to Finish | 2.55 |
| Up & Down % (<25 yds) | 56% |
| Up & Down % (25–50 yds) | 25% |
Scratch golfer short-game performance
Scratch golfers set the standard for elite short-game efficiency. They get up and down more than half the time (54 percent) and average just 2.45 shots to finish from inside 50 yards. Average proximity tightens to just 11 feet, meaning they leave themselves realistic one-putt chances on most missed greens. The biggest edge comes from consistency. Scratch players convert short putts and handle bunkers with nearly double the success of higher handicaps.
| Metric | Value |
|---|---|
| Up & Down % (0–50 yds) | 54% |
| Sand Save % | 37% |
| Average Proximity to Hole | 11 ft |
| Shots to Finish | 2.45 |
| Up & Down % (<25 yds) | 63% |
| Up & Down % (25–50 yds) | 32% |
Final thoughts
As handicap drops, short-game performance improves across every metric. Proximity seems to be one of the biggest separators in performance. Each five-stroke advance to get closer to that elusive scratch handicap means hitting it about two to three feet nearer the hole and saving about half a stroke per missed green.
If you’re trying to lower scores track your up and down percentage and focus on clean contact and consistency. This data proves that hitting the ball a little closer to the hole more often is the real difference maker.
The post How Good Is Your Short Game? (Performance Chart By Handicap) appeared first on MyGolfSpy.