
As golf fans eagerly await the Ryder Cup at Bethpage Black, the data nerds at Shot Scope dove into the ultimate question: Who’s better at golf, Americans or Europeans?
Look, we all know the Ryder Cup brings out the best and worst in golf fans. Sure, the Europeans invented the game, but Americans perfected the art of yelling “Get in the hole!” from 250 yards out and turning golf carts into mobile beer dispensaries.
But what happens when you take 7,000 amateur golfers—3,500 from each side of the pond—and pit them against each other in the ultimate data showdown?
Our friends at Shot Scope did exactly that, pulling together golfers from six different handicap levels (0, 5, 10, 15, 20, 25, and 30) to settle this once and for all.
Think of it as the Ryder Cup, but with significantly more three-putts and lost balls.
Round 1: Driving distance
Winner: USA (USA! USA!)
Here’s where Americans get to chest-thump a little. Team USA averaged 246 yards compared to Europe’s 230 yards—a 16-yard difference that probably explains why American golfers always seem so confident despite shooting 95.
This uses Shot Scope’s Performance Average, which removes the outliers (sorry, that 320-yard bomb you hit once doesn’t count) to show what a well-struck shot actually travels.
Round 2: Driving accuracy
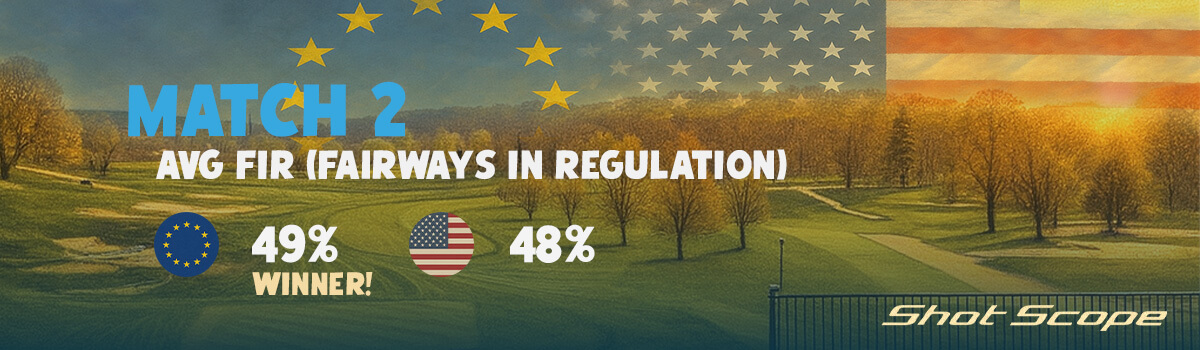
Winner: Europe (dammit)
And just like that, the Europeans strike back. Team Europe finds the fairway 49 percent of the time compared to America’s 48.
Sure, it’s only a one percent difference, but in golf—a game where we argue about whether that putt was actually 2 feet 11 inches or three feet—margins matter.
Round 3: Lost balls off the tee

Winner: Europe
This one stings for Team USA. Europeans lose 1.08 balls per round compared to Americans’ 1.62. That’s 0.54 fewer lost balls per round, which might not sound like much until you realize that’s about $2 less spent per round on replacing Pro V1s you’ll never see again.
Round 4: Greens in regulation
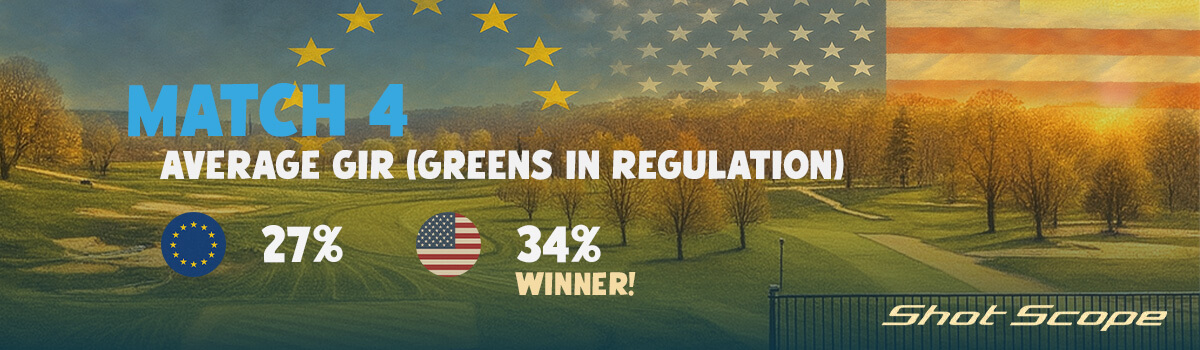
Winner: USA
Americans bounce back with better iron play, hitting six greens per round (34 percent) compared to Europe’s five (27 percent). This is where that extra driving distance starts to pay dividends—shorter irons into greens apparently make a difference. Who knew?
Round 5: Proximity to pin from 50 yards

Result: Tie
Both teams average 33 feet from the pin when hitting from 50 yards. Either both continents have figured out the secret to wedge play or everyone is equally terrible at it. You decide.
Round 6: Proximity to pin from 100 yards

Winner: Europe
Team Europe edges this one 51 feet to 54 feet. Not exactly sticking it close but, hey, three feet closer is three feet closer. Europeans are apparently slightly better at judging that awkward in-between wedge distance.
Round 7: Up-and-down percentage
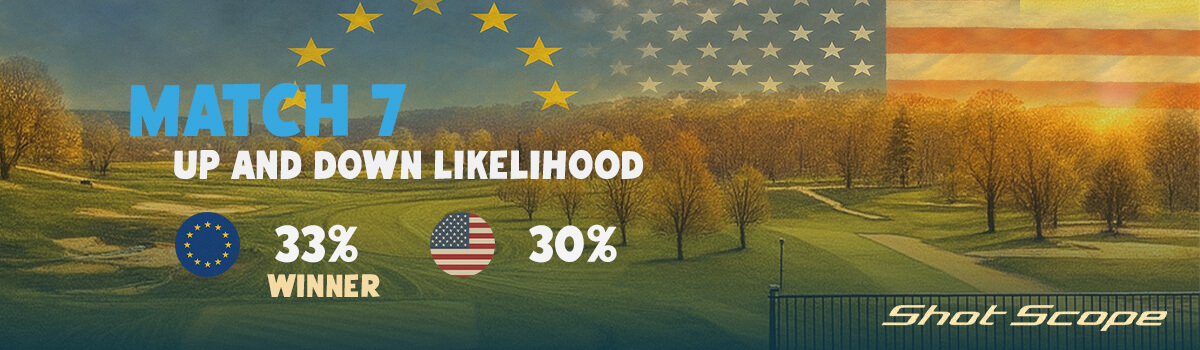
Winner: Europe
Europeans get up and down 33 percent of the time compared to Americans’ 30. Given how many greens both teams are missing, this short game prowess is crucial for not turning bogeys into doubles.
Round 8: Sand saves
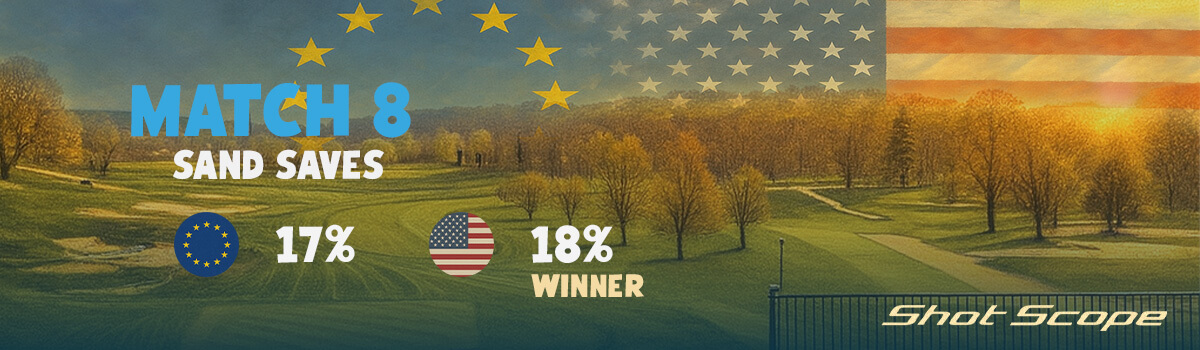
Winner: USA
Americans win this by the slimmest of margins—18 percent to 17. Both teams are essentially flipping a coin when they find the beach but at least Americans can claim superiority in something involving sand that isn’t volleyball.
Round 9: Three-putt avoidance
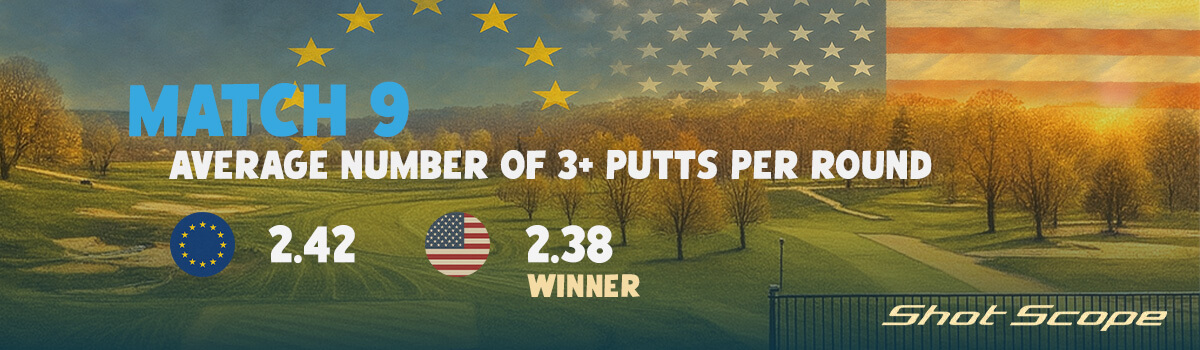
Winner: USA
Team USA averages 2.38 three-putts per round compared to Europe’s 2.42. That’s right. Americans are slightly better at not completely losing their minds on the greens. Progress!
Round 10: Short putt percentage

Winner: Europe
Europeans make 54 percent of their short putts compared to Americans’ 51. In match play, where confidence and momentum swings can decide matches, this three-percent edge could be the difference between shaking hands and throwing your putter in the pond.
Round 11: Birdies per round

Winner: USA
Americans manage 0.9 birdies per round compared to Europe’s 0.7. Not exactly setting the world on fire, but when you’re making less than one birdie per round, every tenth of a birdie counts.
Round 12: Double bogeys or worse

Winner: Europe
The final category shows Europeans with 3.38 big numbers per round compared to Americans’ 4.13. Europeans are better at avoiding the round-killers that make you question why you took up this stupid game in the first place.
The final tally

Based on Shot Scope’s 12 statistical matchups, Team Europe’s amateurs squeaked out a 6.5-5.5 victory over Team USA.
As an American, I’m legally obligated to mention that this data feels suspicious and probably doesn’t account for intangibles like freedom and hot dog consumption.
Just like in the real Ryder Cup, it came down to the wire. Maybe this suggests we’re in for another nail-biter at Bethpage Black or maybe it just proves that amateur golfers on both sides of the Atlantic are equally capable of finding creative ways to not break 80.
The stats that really matter in match play—hitting fairways, finding greens and making those knee-knocking short putts—slightly favored the Europeans. Meanwhile, Americans showed our strength in raw power and avoiding the dreaded three-putt.
What it all means
If you use a Shot Scope performance tracking product, whether it’s a GPS watch or laser rangefinder, your data probably contributed to this epic showdown. Were you on the winning team?
As for the 2025 Ryder Cup at Bethpage Black? If the amateurs are this evenly matched, we might be in for one hell of a weekend. Hopefully with fewer lost balls and three-putts than this amateur version.
The post USA Versus Europe: The Amateur Ryder Cup appeared first on MyGolfSpy.